NO ME SALEN
THEORETICAL NOTES AND EXERCISES OF
PHYSICS AND BIOPHYSICS
|
|

|
The graph
Very useful kinematic tool, that consists of drawing the trajectory and assigning the kinematic information that it is given, in the proximity (as close as possible) of the corresponding position. It is the most simple of the kinematic tools. It has the ability to organize spatially and temporarily all the given information, also data that we do not know and want to look for. It is virtuous due to its way of organizing and naming everything taken into consideration in a problem, given data or unknown. What it is hold by a graph is not lost. A well drawn and complete graph can guarantee that the exercise will be well solved.
Lets do it step by step. I suggest you apply this method in a very nice problem that used to be in the old Physics guide. It was exercise 3.6. Read the statement carefully.
| |
3.6 - A sled starts sliding from rest through an inclined ramp, with constant acceleration. It passes through the first control center with a velocity of 5 m/s, and through the second control center with a velocity of 15 m/s. If the control centers are 60 meters apart from each other, calculate the acceleration that the object suffers, the distance between the place where the object starts to move and the first control center, and the time elapsed since it started moving until it went through the second control center. |
|
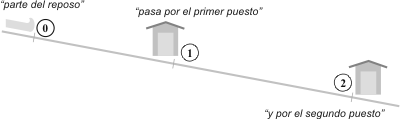
| The first thing we do is draw the trajectory. Then we detect the relevant points, or, what is the same to say, those points mentioned in the statement, and we give them a name: 0, 1, 2, 3... or A, B, C... The ones you like the most. But give them an arbitrary and simple name. You can enhance your drawing with anything that you think will help you to represent the motion: the bridges, the sled... |
|
|
| |
 |
|
|
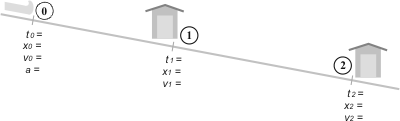
| Of every marked point that we named, a window arises automatically. Always the same window: t, x, v, a, with their respective subindex. |
|
|
| |
 |
|
|
Lets suppose that point M is of our interest, therefore we should inevitably talk about tM, xM, vM y aM. We should do that with every point that we are interested in. It is an automatic window. Notice that I did not assign an acceleration to points 1 and 2: does this mean there is no acceleration in these points? No, as the acceleration is the same for all the motion (the statement tell us so), it is not worth it to assign a subindex and a value more than once.
|
|
|
| |
 |
|
|
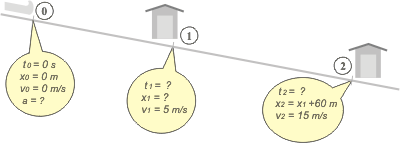
Finally we should fill every window (every bubble) with all the information that you can get, and with the decisions you make, like -in most cases- the value 0 for the times. Everything the statement says ends up in the graph. We should suspect if there is something that the statement says that is not in the graph. You should place a question mark in the information you ignore, the unknowns. This means they already have a name, which is to say enough. The graph is the best tool to contrast the interpretation of the statement with the statement itself, a way of exercising text interpretation.
Everything has got a precise name already that will not be lost or confused. Being data o unknown. If you want to know the solution for this problem, here is the link: sled.
|
|
|
NOTE: a summary of the topic: |
|
|
Steps to taken into consideration when making a graph:
1) draw the trajectory
2) indicate on the trajectory all the events mentioned in the statement
3) name every event "N"
4) include the window tN , xN , vN and aNfor each event.
5)complete the each window the more you can: data, decisions...
6) contrast what the statement says with what you have drawn and see if it is the same
|
|
 |
| |
|
| Translated by Gonchu Beviglia. Some Rights Reserved. Not allowed to be copied without naming either the author or this source material. Last Updated may-10. Buenos Aires, Argentina. |
|
|
|